
ROSELAND, N.J., April 25, 2018 /PRNewswire/ -- Wages for U.S. workers grew 2.9 percent over the last year, increasing the average wage level by $0.57 to $27.36 an hour, according to the ADP Research Institute ® Workforce Vitality Report (WVR) released today. The growth, down from 3.1 percent annual growth as of December 2017, was driven by strong wage gains for workers in the information industry (5.6 percent wage growth, $41.38 average hourly wage), in the West (3.5 percent, $29.27) and from small businesses (3.3 percent, $25.47). Employees in the resources and mining industry (1.7 percent, $34.96) and in the South (2.5 percent, $25.61) had the slowest wage growth.

"In the first quarter of 2018 we saw an acceleration in wage growth for job switchers," said Ahu Yildirmaz, co-head of the ADP Research Institute. "Additionally, as the labor market tightens employers in some industries are paying a premium for talent with special skills. Job holders, job switchers and new entrants in the construction and information industries are all experiencing significant wage growth as employers seek to attract and retain the skilled labor these industries require."
Among industries, information continued to lead the way for both wage level and wage growth. In addition to the top overall wage growth number of 5.6 percent, new entrants into the information field had 7.6 percent wage growth. Those who successfully switched positions within the information industry had wage growth of 8.3 percent. Employment in the information industry, however, grew just 1.2 percent.
The resources and mining industry had the lowest overall wage growth, just 1.7 percent. New entrants into the field showed negative wage growth, at -3.5 percent. Employment in the resources and mining industry grew 4.2 percent.
Table 1: Wage and Employment Growth by Industry – March 2018
|
Industry |
Wages |
YOY Wage Growth |
Yearly Growth |
||||
|
All |
Holders |
Entrants |
Switchers |
Employment Growth |
Switching Rate |
||
|
-ALL- |
$27.36 |
2.9% |
4.9% |
5.2% |
4.4% |
1.8% |
21.3% |
|
Goods |
|||||||
|
Resources and Mining |
$34.96 |
1.7% |
5.4% |
3.5% |
3.2% |
4.2% |
13.4% |
|
Construction |
$27.56 |
2.2% |
5.6% |
6.8% |
7.3% |
2.8% |
15.5% |
|
Manufacturing |
$28.44 |
2.6% |
4.7% |
6.5% |
4.7% |
1.2% |
17.5% |
|
Services |
|||||||
|
Trade, Transportation, and Utilities |
$24.11 |
3.1% |
4.8% |
6.6% |
3.0% |
1.0% |
22.8% |
|
Information |
$41.38 |
5.6% |
6.3% |
7.6% |
8.3% |
1.2% |
17.7% |
|
Finance and Real Estate |
$32.41 |
2.3% |
4.7% |
0.7% |
6.6% |
1.6% |
18.6% |
|
Professional and Business Services |
$34.79 |
2.9% |
5.0% |
4.8% |
8.6% |
1.5% |
25.0% |
|
Education and Health Services |
$26.17 |
2.8% |
4.0% |
2.6% |
1.0% |
2.5% |
20.1% |
|
Leisure and Hospitality |
$16.77 |
4.3% |
6.4% |
3.9% |
-4.1% |
2.6% |
26.1% |
Workers in the West continued to outpace other regions with 3.5 percent wage growth. Employees who switched firms in the West experienced 8.2 percent wage growth. Workers in the South had the lowest wage growth at 2.5 percent. By firm size, workers at small firms had the highest wage growth rate at 3.3 percent, though employment growth for small firms was just 0.8 percent.
Table 2: Wage and Employment Growth by Region and Firm Size – March 2018
|
Region |
Wages |
YOY Wage Growth |
Yearly Growth |
||||
|
All |
Holders |
Entrants |
Switchers |
Employment Growth |
Switching Rate |
||
|
-USA- |
$27.36 |
2.9% |
4.9% |
5.2% |
4.4% |
1.8% |
21.3% |
|
MIDWEST |
$25.41 |
2.8% |
4.7% |
4.9% |
1.9% |
1.1% |
20.2% |
|
NORTHEAST |
$30.92 |
3.1% |
4.8% |
5.1% |
5.4% |
1.3% |
22.6% |
|
SOUTH |
$25.61 |
2.5% |
4.6% |
3.8% |
3.0% |
1.8% |
21.2% |
|
WEST |
$29.27 |
3.5% |
5.6% |
7.4% |
8.2% |
2.8% |
21.5% |
|
Company Size |
|||||||
|
-ALL- |
$27.36 |
2.9% |
4.9% |
5.2% |
4.4% |
1.8% |
21.3% |
|
49 or less |
$25.47 |
3.3% |
4.6% |
4.4% |
6.0% |
0.8% |
15.0% |
|
50 to 499 |
$27.65 |
2.9% |
4.9% |
5.2% |
4.2% |
2.0% |
23.3% |
|
500 to 999 |
$28.69 |
1.4% |
5.1% |
3.6% |
4.4% |
2.3% |
22.1% |
|
1000 or more |
$28.14 |
2.9% |
5.0% |
5.8% |
4.0% |
2.3% |
24.3% |
The WVR also revealed that more than 21.3 percent of U.S. employees successfully switched firms in the last year. The highest level of switching was from the information industry to the professional and business services industry. Of all the information workers who switched firms, 30 percent switched to the professional and business services industry.
Table 3: Switchers' Movement by Industry – March 2018
|
Industry from |
Industry To |
||||||||
|
CONST |
EDUCH |
FINRE |
INFO |
LEISH |
MFG |
PROFE |
RESM |
TRADE |
|
|
Construction |
42.2% |
5.3% |
4.8% |
0.7% |
12.1% |
4.9% |
12.2% |
0.5% |
14.6% |
|
Education and Health Services |
1.4% |
61.7% |
3.8% |
0.6% |
7.0% |
2.3% |
10.7% |
0.0% |
9.3% |
|
Finance and Real Estate |
4.2% |
14.1% |
30.7% |
1.5% |
9.4% |
3.3% |
18.1% |
0.2% |
16.2% |
|
Information |
2.0% |
9.1% |
6.1% |
12.8% |
8.0% |
5.8% |
30.2% |
0.2% |
23.2% |
|
Leisure and Hospitality |
3.2% |
8.4% |
3.3% |
0.8% |
52.1% |
2.8% |
11.6% |
0.1% |
15.5% |
|
Manufacturing |
4.6% |
6.5% |
2.6% |
1.4% |
6.7% |
33.3% |
15.7% |
0.4% |
27.0% |
|
Professional and Business Services |
3.2% |
11.5% |
5.9% |
3.3% |
8.9% |
6.7% |
40.8% |
0.3% |
17.3% |
|
Resources and Mining |
10.3% |
2.5% |
4.5% |
0.8% |
2.3% |
12.5% |
16.8% |
30.2% |
19.2% |
|
Trade, Transportation, and Utilities |
2.9% |
9.3% |
4.1% |
1.4% |
12.3% |
7.8% |
13.8% |
0.3% |
45.6% |
To see detailed workforce vitality components for the first quarter of 2018, including data broken down by region, firm size, industry, gender, and age, visit http://workforcereport.adp.com/. The second quarter 2018 ADP Workforce Vitality Report will be released on Wednesday, July 25, 2018
About the ADP Workforce Vitality Report
The ADP Workforce Vitality Report (WVR) was developed by the ADP Research Institute (ADPRI). It is an unprecedented, in-depth monthly analysis (published quarterly) of the vitality of the U.S. labor market based on actual data that identifies labor market trends and dynamics across multiple dimensions. These dimensions include employment growth, job switching, wage growth and hours worked. In addition to the macro data presented in the report, there are also segment-specific findings by industry, state, gender, age, experience, and pay level. Established in October 2014, the report methodology was updated in April 2018 utilizing monthly data to include additional data points and deeper insights. For more information about the report, please visit http://workforcereport.adp.com/.
About ADP (NASDAQ-ADP)
Powerful technology plus a human touch. Companies of all types and sizes around the world rely on ADP cloud software and expert insights to help unlock the potential of their people. HR. Talent. Benefits. Payroll. Compliance. Working together to build a better workforce. For more information, visit ADP.com.
ADP, the ADP logo, ADP A more human resource and ADP Research Institute are registered trademarks of ADP, LLC. All other marks are the property of their respective owners.
Copyright © 2018 ADP, LLC.
ADP - Media
![]()
![]() View original content with multimedia:http://www.prnewswire.com/news-releases/us-wages-grow-2-9-percent-over-past-year-information-industry-experienced-highest-wage-growth-of-5-6-percent-300635698.html
View original content with multimedia:http://www.prnewswire.com/news-releases/us-wages-grow-2-9-percent-over-past-year-information-industry-experienced-highest-wage-growth-of-5-6-percent-300635698.html
SOURCE ADP, LLC
 Facebook
 X
X YouTube
 LinkedIn
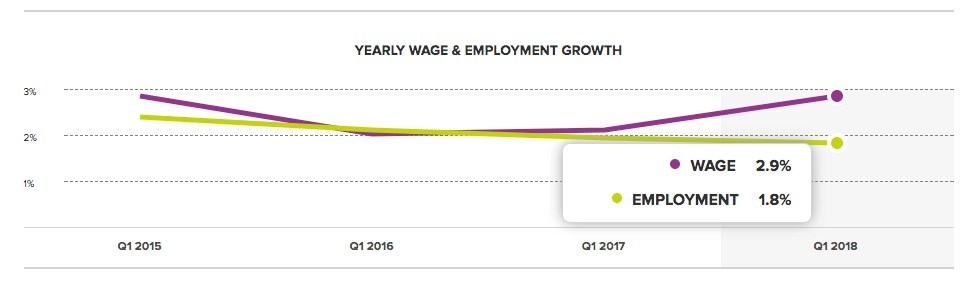
For media inquiries, connect with our media relations team for press materials, interviews and expert commentary or reach out directly to a member of our team.
Stay informed! Sign up for email notifications to receive updates from our Newsroom.