ROSELAND, NJ -- (Marketwired) -- 01/27/16 -- The ADP® Workforce Vitality Report (WVR) has undergone a series of enhancements that enable a deeper look at wage growth. Enhancements to the WVR data include:
- Wage growth based on tracking the same job holders over time, including full-time and part-time workers
- A deeper look at job switchers (those who change jobs) based on whether they switch from a full-time job to another full-time job, from full-time to part-time, from part-time to full-time or from part-time to part-time
- Tracking job switchers who move from one region to another and from one industry to another
Overall wage growth, as reported by the Bureau of Labor Statistics (BLS) and the WVR, is fairly consistent at a bit over 2 percent year over year in the fourth quarter of 2015. The BLS measure grew by 2.4 percent while the WVR measure grew by 2.1 percent. These numbers are derived from an "establishment-based" method, which includes both those who leave the workforce, as well as those just entering. Since those who leave are typically much more highly paid than those entering, this type of churn could have the effect of bringing aggregate wage growth down.
Removing new entrants and those who have retired or otherwise left the workforce, while tracking the same group of job holders over time, gives a clearer picture of actual wage growth. Additionally, looking into the mix of workers changing jobs between full-time and part-time work adds perspective about labor market dynamics.
Chart 1 below shows overall wage growth of 2.1% using the establishment-based method and the wage growth of only full-time job holders and job switchers. When tracking individual workers whether they are job holders or switchers, we find that wage growth is higher than growth calculated using the establishment-based method. Following only full-time workers, wage growth is 4.1% for job holders and 4.7% for job switchers.
To see Chart 1: Annual Wage Growth 4Q 2015, please click here: http://media.marketwire.com/attachments/201601/MOD-22860_Chart1AnnualWageGrowth4Q2015.jpg
"Being able to track the same large group of workers who are consistently employed gives us a much different look at wage dynamics," said Ahu Yildirmaz, VP and head of the ADP Research Institute®. "Wage growth appears to be more robust than generally reported."
Table 1 below offers a look at wage growth for all full-time job holders and job switchers by industry.
Wage growth for individual workers varied extensively across industries during the past year. Sectors such as information, finance and real estate, and professional and business services improved measurably during the year. Although job holders did well in the manufacturing and construction industries, job switchers did not fair as well. Leisure and hospitality, education and health services, finance and real estate, information and professional and business services offer better opportunities for job switchers. No surprise given the struggles in the energy sector due to falling oil prices, growth is lowest among both job holders and switchers in natural resources and mining.
TABLE 1: Q4 2015 Wage Growth by Industry
| YOY Wage Growth | Full-Time | |
| Holders | Switchers | |
| ALL | 4.1% | 4.7% |
| Manufacturing | 4.5% | 2.0% |
| Construction | 4.5% | 3.4% |
| Resources and Mining | 0.3% | -6.4% |
| Finance and Real Estate | 4.3% | 6.6% |
| Information | 5.7% | 6.4% |
| Professional and Business Services | 4.4% | 6.3% |
| Leisure and Hospitality | 3.9% | 8.2% |
| Education and Health Services | 3.7% | 7.9% |
| Trade, Transportation, and Utilities | 3.6% | 4.6% |
Table 2 shows that those who change from part-time to full-time work experience a decrease in average hourly earnings in most industries. This implies workers are willing to accept lower average hourly wages if full-time work comes with benefits and higher total income. However, manufacturing, leisure and hospitality and trade, transportation, and utilities are exceptions. In these industries hourly wages for switchers increased over the past year.
TABLE 2: Wage Growth for Switchers Who Move from Part-time to Full-time
| YOY Wage Growth | Switchers |
| ALL | -5.8% |
| Manufacturing | 5.2% |
| Construction | -1.7% |
| Resources and Mining | -6.7% |
| Finance and Real Estate | -7.0% |
| Information | -9.1% |
| Professional and Business Services | -5.6% |
| Leisure and Hospitality | 11.8% |
| Education and Health Services | -1.4% |
| Trade, Transportation, and Utilities | 7.4% |
The highest wage growth for job holders by region is in the West which, as reported in the ADP Regional Employment Report®, also has the highest employment growth. Interestingly, the South, the region with the second highest employment growth, has the lowest wage growth. The Northeast, lowest in employment growth, is the best place to change jobs with easily the highest wage growth for job switchers. This could be due to the preponderance of highly paid financial and tech jobs in the region.
TABLE 3: 4Q 2015 Wage Growth by Region
| YOY Wage Growth | Full-Time | |
| Holders | Switchers | |
| ALL | 4.1% | 4.7% |
| Midwest | 4.1% | 5.3% |
| Northeast | 4.1% | 5.8% |
| South | 3.8% | 3.9% |
| West | 4.5% | 5.0% |
Table 4 below illustrates wage growth by age, which we have seen in past reports is most robust on a percentage basis for workers under 35. This is due to their lower base wage. Workers who are 55 and older show negligible wage growth when they switch jobs. This is possibly due to difficulty for older workers to find new jobs and they settle for marginal increases, or even pay cuts. Table 5, growth by income group, is consistent with Table 4.
TABLE 4: Wage Growth by Age Q4 2015
| YOY Wage Growth | Full-Time | |
| Holders | Switchers | |
| ALL | 4.1% | 4.7% |
| 25 and younger | 8.7% | 11.9% |
| 25 - 34 | 6.8% | 8.3% |
| 35 - 54 | 3.8% | 3.4% |
| 55 and older | 2.1% | 0.2% |
TABLE 5: Wage Growth by ncome Group Q4 2015
| YOY Wage Growth | Full-Time | |
| Holders | Switchers | |
| ALL | 4.1% | 4.7% |
| 20k or less | 13.8% | 59.6% |
| 20k to 50k | 6.1% | 11.9% |
| 50k to 75k | 4.9% | 6.7% |
| 75k or more | 3.6% | 3.4% |
The 1st Quarter 2016 ADP Workforce Vitality Report will be released on Wednesday April 20, 2016.
About the ADP Workforce Vitality Report
The ADP Workforce Vitality Report was developed by the ADP Research Institute in collaboration with Moody's Analytics. It is an unprecedented, in-depth quarterly analysis of the vitality of the U.S. labor market based on actual data that identifies labor market trends and dynamics across multiple dimensions. These dimensions include employment growth, job turnover, wage growth and hours worked. In addition to the macro data presented in the report, there are also segment-specific findings by industry, state, gender, age, experience, and pay level. For more information about the report, please visit http://workforcereport.adp.com/.
About Moody's Analytics
Moody's Analytics helps capital markets and risk management professionals worldwide respond to an evolving marketplace with confidence. The company offers unique tools and best practices for measuring and managing risk through expertise and experience in credit analysis, economic research and financial risk management. By providing leading-edge software, advisory services, and research, including the proprietary analysis of Moody's Investors Service, Moody's Analytics integrates and customizes its offerings to address specific business challenges. Moody's Analytics is a subsidiary of Moody's Corporation (NYSE: MCO), which reported revenue of
About ADP (NASDAQ: ADP)
Powerful technology plus a human touch. Companies of all types and sizes around the world rely on ADP's cloud software and expert insights to help unlock the potential of their people. HR. Talent. Benefits. Payroll. Compliance. Working together to build a better workforce. For more information, visit ADP.com.
The ADP logo, ADP, ADP Research Institute and ADP Regional Employment Report are registered trademarks of ADP, LLC. ADP A more human resource. is a service mark of ADP, LLC. All other marks are the property of their respective owners. Copyright © 2016 ADP, LLC.
ADP - Media
Media Contacts:
Dick Wolfe
ADP
(973) 974-7034
dick.wolfe@adp.com
Source: ADP, LLC
News Provided by Acquire Media
 Facebook
 X
X YouTube
 LinkedIn
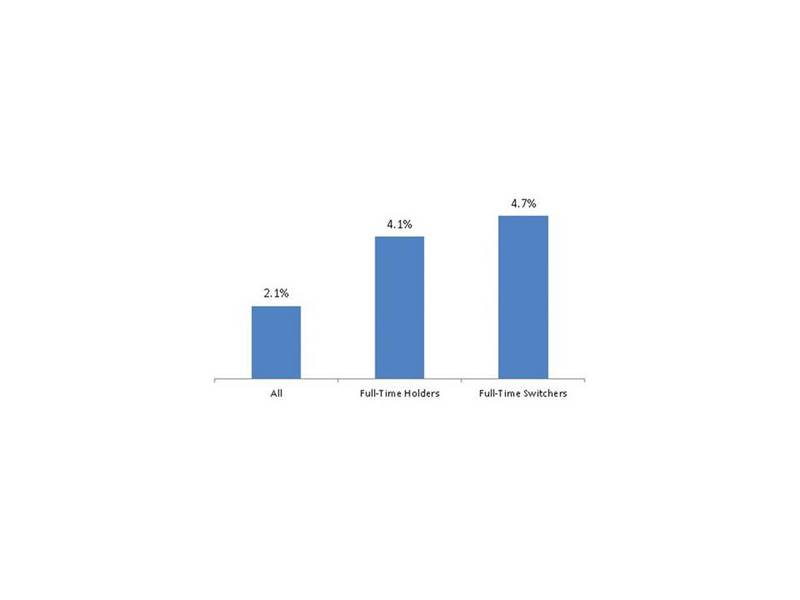
For media inquiries, connect with our media relations team for press materials, interviews and expert commentary or reach out directly to a member of our team.
Stay informed! Sign up for email notifications to receive updates from our Newsroom.